Sign up before Midnight to watch our video,
“Biggest Ponzi Scheme in U.S. History to Crash,”
and get our daily e-letter Investment Contrarians.
We respect your privacy!
We will never rent/sell your e-mail address.
That’s a promise! And you can opt out at any time.
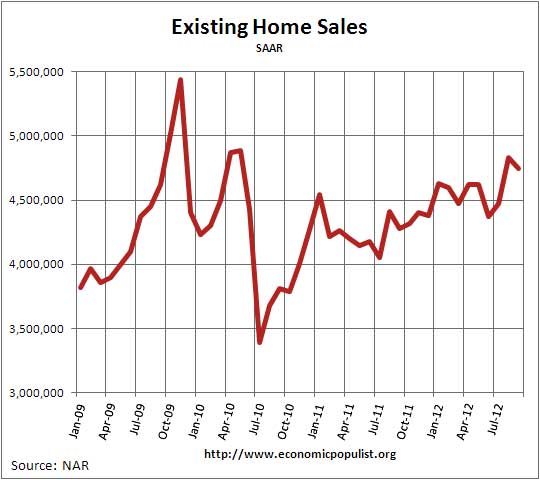
NAR reported their September 2012 Existing Home Sales.
Existing home sales decreased -1.7% from last month and inventories
are down to a now tight 5.9 months of supply. Existing homes sales
have increased 11.0% from a year ago. Volume was 4.75 million,
annualized against August's revised up, from 4.82 to 4.83 million,
annualized existing home sales.
 Inventory decreased 3.3% or 2.32 million existing homes for sale.
This is a 5.9 months supply and down 20.0% from a year ago.
The national median existing home sales price, all types, is up, now at $183,900, a 11.3% increase from a year ago. This is the 7th month in a row for price increases and hasn't happened since at the cusp of the housing bubble, 2005-2006. It's clear foreclosures, REOs are being held off of the market as well as down. Below is the breakdown by types of sales:
 It's not that people got back on their feet and there are less people
in trouble, losing their homes, it's more the various laws, delays and
rulings on foreclosures that is causing the drop and this is clearly
affecting existing home sales supply.
Article Via http://www.economicpopulist.org

The national median existing home sales price, all types, is up, now at $183,900, a 11.3% increase from a year ago. This is the 7th month in a row for price increases and hasn't happened since at the cusp of the housing bubble, 2005-2006. It's clear foreclosures, REOs are being held off of the market as well as down. Below is the breakdown by types of sales:
Distressed homes - foreclosures and short sales sold at deep discounts - accounted for 24 percent of September sales (13 percent were foreclosures and 11 percent were short sales), up from 22 percent in August; they were 30 percent in September 2011. Foreclosures sold for an average discount of 21 percent below market value in August, while short sales were discounted 13 percent.According to NAR 30.7% of existing homes were on the market less than a month.
The median time on market was 70 days in September, unchanged from August, but down 30.7 percent from 101 days in September 2011. Thirty-two percent of homes sold in September were on the market for less than a month, while 19 percent were on the market for six months or longer.Yet all cash sales, implying investors are still snatching up homes, are still high.
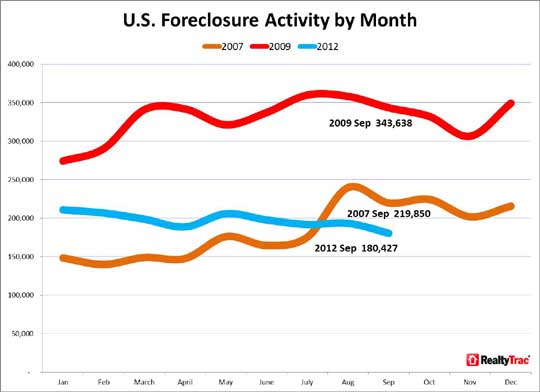
First-time buyers accounted for 32 percent of purchasers in September, compared with 31 percent in August; they were 32 percent in September 2011.Realtytrac reported foreclosures were at a 5 year low in September.
All-cash sales were at 28 percent of transactions in September, up from 27 percent in August; they were 30 percent in September 2011. Investors, who account for most cash sales, purchased 18 percent of homes in September, unchanged from August; they were 19 percent in September 2011
Foreclosure filings — default notices, scheduled auctions and bank repossessions — were reported on 180,427 U.S. properties in September, a decrease of 7 percent from the previous month and down 16 percent from September 2011. September’s total was the lowest U.S. total since July 2007.
Foreclosure filings were reported on 531,576 U.S. properties during the quarter, a decrease of 5 percent from the second quarter and a decrease of 13 percent from the third quarter of 2011 — the ninth consecutive quarter with an annual decrease in foreclosure activity. The report also shows one in every 248 U.S. housing units with a foreclosure filing during the quarter.

Days to foreclose at record 382 days, legislation extends process in some states U.S. properties foreclosed in the third quarter took an average of 382 days to complete the foreclosure process, up from 378 days in the previous quarter and up from 336 days in the third quarter of 2011. It was the highest average number of days to foreclose going back to the first quarter of 2007.Yet contingent short sales, not part of existing home sales active listings, were up.
As a supplement to the report, RealtyTrac analyzed nationwide short sale transactions occurring on properties not yet in the foreclosure process and found that those increased 18 percent on a year-over-year basis for the period of January through May. These non-foreclosure short sales accounted for 14 percent of all sales during this time period, a bigger percentage than either pre-foreclosure sales or bank-owned sales.Last month's existing home sales overview is here, unrevised.
Article Via http://www.economicpopulist.org
Sign up before Midnight to watch our video,
“Biggest Ponzi Scheme in U.S. History to Crash,”
and get our daily e-letter Investment Contrarians.
We respect your privacy!
We will never rent/sell your e-mail address.
That’s a promise! And you can opt out at any time.
No comments:
Post a Comment